Spring Boot 3.3 + OpenTelemetry (Agent) with otel-lgtm

Hello everyone, Thank you for interesting in this blog post. This blog was starting because I read blog from Grafana about new container image “otel-lgtm” which included OpenTelemetry Collector and LGTM Stack for observability purpose
For sure, I saw it might the potential way to setup observability for home lab and side project. Therefore, I created new Spring Boot 3.3 project template for utilizing otel-lgtm container and organize it to the blog post.
Anyway, Feel free to use my code repository as template or example for your service/project. I provided the one way to using OpenTelemetry Collector with agent and you can utilize it when connect to your observability tools.
Getting Started
GitHub Repository
Tech Stack
- Spring Boot 3.3
- Java 21
- Gradle
- PostgreSQL
- OpenTelemetry agent to using with collector
Gradle build with OpenTelemetry Agent
My approach was creating agent configuration and put it on build directory instead of download when build new image. So the project structure after build will become like below image

Dockerfile & Compose file
Note
I used Podman on my laptop and faced some issue with testcontainer ryuk image. So I fix it by using below flag in order to build or running something relate to Spring Boot. I believe your life is easier if you use Docker on your laptop instead of Podman 😆
export TESTCONTAINERS_RYUK_DISABLED=trueExample of HTTP Client by Intellij IDEA
Note
- GET /coupons — Has random delay for simulate long process traffic
- GET /coupons/active — Has random 500 for simulate failure response
Dashboard from LGTM container
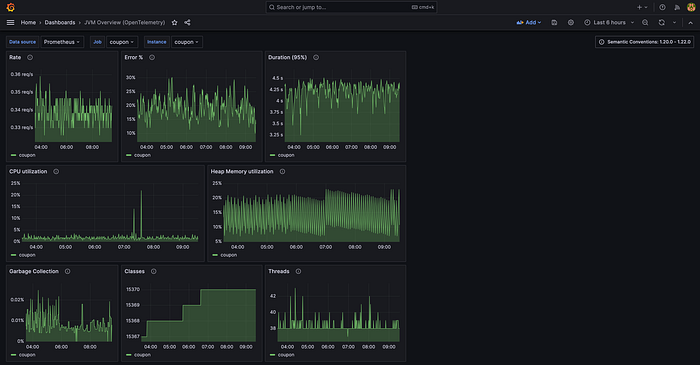
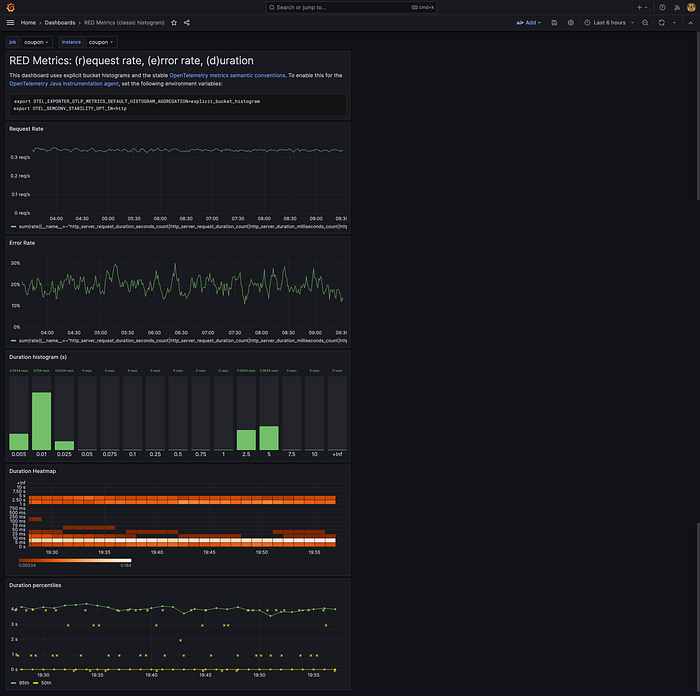
After run the compose, It seem container already included some dashboards for support our Spring Boot project
- JVM Overview (OpenTelemetry)
- RED Metrics
So I created some traffic to see how dashboard look like
Custom Dashboard
Since the previous are all about metric. I had created simple dashboards for tracing and logging purpose as well for the side project template.
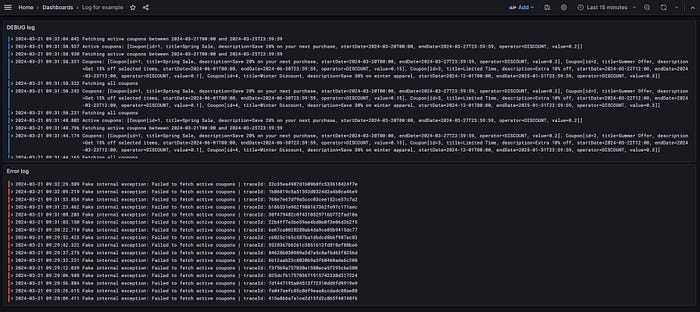
Loki — Logging purpose
First custom dashboard is the Loki dashboard to see debug log
{job="coupon", level="DEBUG"} | json | line_format "{{.body}}"And then error log
{job="coupon", level="ERROR"} | json | line_format "{{.body}} | traceId: {{.traceid}}"You can import Logging Dashboard here to your Grafana https://github.com/marttp/spring-boot-lgtm-opentelemetry-template/blob/main/dashboard/loki-log.json
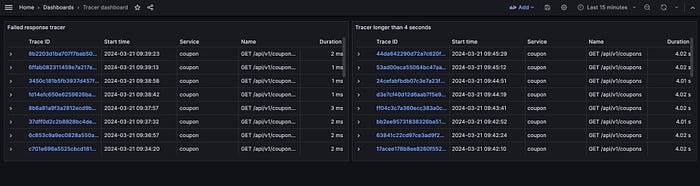
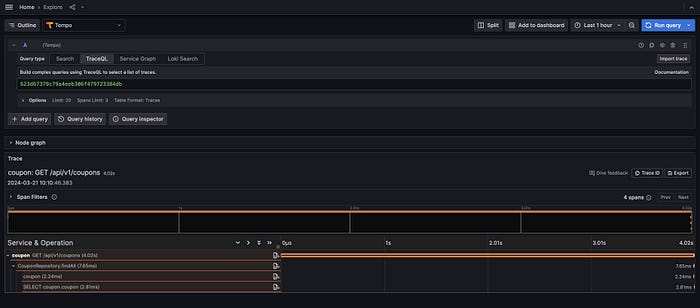
Tempo — Tracing purpose
Failed response tracer
{.service.name="coupon" && .http.response.status_code=500}Tracer longer than 4 seconds
{.service.name="coupon" && duration>4s}You can import the tracing dashboard here https://github.com/marttp/spring-boot-lgtm-opentelemetry-template/blob/main/dashboard/tracer-fail-long.json
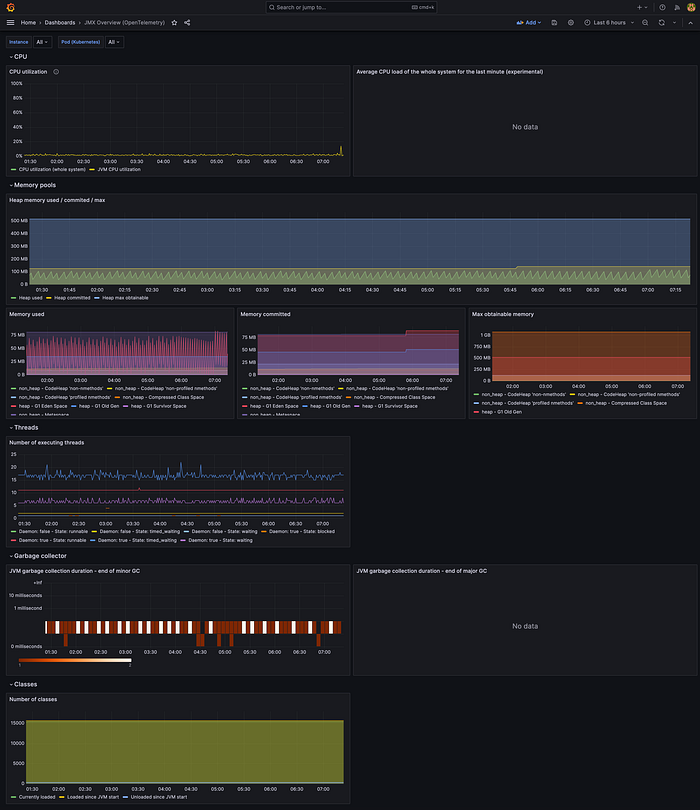
Last but not least, I import JMX Overview (OpenTelemetry) dashboard from Grafana Labs to get other informations from our Spring Boot project
The result after using this dashboard
Summary
I believe new container “otel-lgtm” is really good fit for homelab or side project. However, If you have your own configuration, please mapping volume to container for persist your dashboard and data.
In the world of cloud native, There are so many tools which designed for vendor agnostic and OpenTelemetry is one of them to help you integrated your observability data to Metric/Logging/Tracing tools of your choices.
Anyway, On the enterprise software, I still recommended to deploy the service independently for the scalable purpose or if you interest in LGTM stack. You might interest in Grafana Cloud but for this container, you can do it on your locally for development purpose.
Thank you for reading the blog post. Hope you have learn something from my writing. See you in the next blog post. 🙇♂️
Facebook: Thanaphoom Babparn
FB Page: TP Coder
LinkedIn: Thanaphoom Babparn
Linktree: https://linktr.ee/tpbabparn